Thursday, May 05, 2005
Dynamic line graphs that work with zeros in Excel
I make a lot of graphs for financial reporting for clients. In most cases these are made in database type files that have monthly data imported from a large accounting system. In most cases I need to produce line graphs that will take the whole years results, but only show up to the current month.
The main problem with this is that if you have a line graph for 12 periods, but you only have values in the first 3 months your line will go up and down for 3 months and then for the remainder of the year go down to the x axis and stay there. See figure 1 for an example.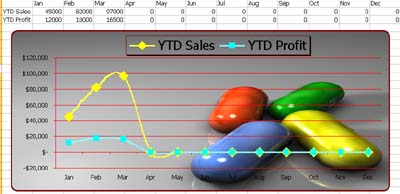
The best way I have discovered to resolve this is to use #N/A errors deliberately.
In most cases the file will have a current month selected. I use this for report headers etc. It is also used for the graphing.
Using a formula similar to =IF(monthdate>currentdate,#N/A,data) I can generate #N/A errors deliberately for the months where I have no data.
#N/A never shows up in a graph. Thus we have created a line graphs that can be dynamically updated. See figure 2.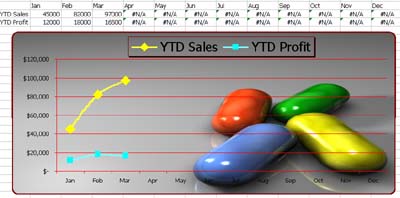
The Excel Guru's Free Tips and Hints.

Welcome
Welcome to the Excel Tips blog. Free Microsoft Excel Tips and Hints designed to increase your productivity.
Advertisement
Subscribe Me
Previous Posts
- Rounding to nearest 5 cents in Excel
- Using the COUNT functions in Excel
- Filtering by the Date field in Excel
- Moving is complete - regular transmission to resum...
- Moving house - no posts for a week
- Two type charting
- Using the Resize property in Excel VBA to change a...
- How to complete Bart Simpsons lines in Excel
- Using Freeform lines in Excel
- Using the MAX function in a CSE Formula in Excel
My Blogs and Websites
- Spy Journal Home
- Spy Journal Archives
 Personal Blog
- Excel Tips Blog
- Blog Tips Blog
- Tech Tips Blog
- Urban Space Novel
- Photo Archive
- Parklife Results
- Parklife Soccer Club Website
- KROSTech LAN Parties
- Jethro Management
- Jethro Consultants
- Oz Bush Poet
Excel Links
- ---RSS Feeds---
- Unofficial Microsoft Office Stuff
- KC on Exchange and Outlook
- Office Zealot
- Automate Excel
- Colo's Excel Junk room
- Daily Dose Of Excel
- The Planning Deskbook
- Excel Pragma
- Andrew's Excel Tips
- ---No RSS Feed---
- Excel Tip
- Mailbarrow
- Experts Exchange
- AJP Excel Information
- Beyond Technology
- Contextures
- ExcelTip
- Mr Excel
- Pearson Software Consulting
- Peltier Technical Services
- John Walkenbach - J-Walk
- Vangelder (wont work in Firefox)
- VBA Express
- xlDynamic
- The Excel Nexus
- Code Net
- Better Solutions
- Excel Business Tools
- Data Pig Technologies
- VBA Express
Other Links


Copyright Notice. All documents and text contained in this web site www.spyjournal.biz and sub pages is copyright material of Jethro Management (c) 2004 unless noted as being copyright material of someone else. No public reproduction of the content on this site in any form is permitted without express written permission.
Unless otherwise expressly stated, all original material of whatever nature created by Tim Miller and included in this weblog and any related pages, including the weblog's archives, is licensed under a Creative Commons License.