Wednesday, November 24, 2004
Calculating Moving Averages in Excel
Reader's Request:
"How do I calculate a moving average in Excel?"
Moving averages are actually quite simple and can be done a number of ways.
Excel has a chart function allowing a moving average trendline to be added to a chart. Try it. Create a line or bar chart and then select a series, right click and select Add Trendline. A dialog box of alternative trendlines will pop up. Select Moving Average and click OK.
Figure 1.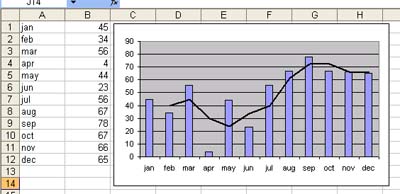
Moving Averages of Data
The following image illustrates two moving average calculations for some sales data.
First I created a table using the RAND() function. I then calulated two moving averages. The first is a simple formula of =AVERAGE(year1:year2) with the year totals being relative and not absolute . This formula is copied down and each calculation is for the year that the formula is on and the previous year
The second formula uses the relative $ on the row number to lock the starting year. Thus the range that the average is calculated over is progressivly larger as it is copied down. The last calculation is the average of all four years. This result gives an average that becomes less and less susceptible to movement as time goes on.
Your choice of method is dependent on the result you want to achieve.
The second method is good for predicting seasonality, the first is better for calculating margin variances between years.
Figure 2.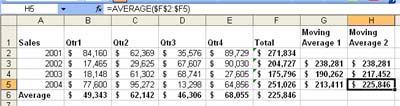
The Excel Guru's Free Tips and Hints.

Welcome
Welcome to the Excel Tips blog. Free Microsoft Excel Tips and Hints designed to increase your productivity.
Advertisement
Subscribe Me
Previous Posts
- Using the formula bar in Excel
- Using Format Painter in Excel, Word, Powerpoint an...
- Make Excel Talk
- Readers requests for tips
- Using the RAND function in Excel
- Hiding and Unhiding rows and Columns in Excel
- Fun with Excel
- Using the SUMIF Function in Excel
- Using Logic Functions in Excel
- Creating blank lines in an Excel Chart
My Blogs and Websites
- Spy Journal Home
- Spy Journal Archives
 Personal Blog
- Excel Tips Blog
- Blog Tips Blog
- Tech Tips Blog
- Urban Space Novel
- Photo Archive
- Parklife Results
- Parklife Soccer Club Website
- KROSTech LAN Parties
- Jethro Management
- Jethro Consultants
- Oz Bush Poet
Excel Links
- ---RSS Feeds---
- Unofficial Microsoft Office Stuff
- KC on Exchange and Outlook
- Office Zealot
- Automate Excel
- Colo's Excel Junk room
- Daily Dose Of Excel
- The Planning Deskbook
- Excel Pragma
- Andrew's Excel Tips
- ---No RSS Feed---
- Excel Tip
- Mailbarrow
- Experts Exchange
- AJP Excel Information
- Beyond Technology
- Contextures
- ExcelTip
- Mr Excel
- Pearson Software Consulting
- Peltier Technical Services
- John Walkenbach - J-Walk
- Vangelder (wont work in Firefox)
- VBA Express
- xlDynamic
- The Excel Nexus
- Code Net
- Better Solutions
- Excel Business Tools
- Data Pig Technologies
- VBA Express
Other Links


Copyright Notice. All documents and text contained in this web site www.spyjournal.biz and sub pages is copyright material of Jethro Management (c) 2004 unless noted as being copyright material of someone else. No public reproduction of the content on this site in any form is permitted without express written permission.
Unless otherwise expressly stated, all original material of whatever nature created by Tim Miller and included in this weblog and any related pages, including the weblog's archives, is licensed under a Creative Commons License.